An early warning model is useful only if it warns clinicians before they already know. Kamran and colleagues (2024) scored the sepsis model from Epic, a health records vendor, at one centre, with and without predictions made after clinicians had recognised sepsis. Sepsis is a life-threatening response to infection.
The model scored an AUROC of 0.62. AUROC is the chance that a model ranks a random patient with the condition above a random patient without it, so 0.5 is a coin toss. With the late predictions excluded, the score fell to 0.47, below a coin toss.
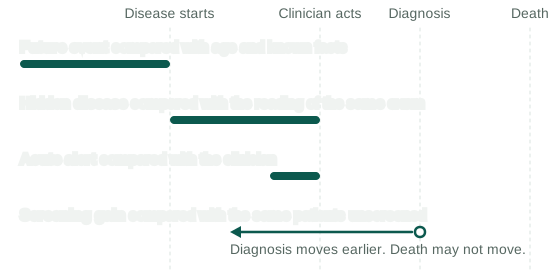
The word “early” covers four different claims, each with its own comparator. A reported score shows that a model was earlier than a clinician only if the design compares the model with what the clinician knew at that moment.
Four claims
An early warning paper can be making any of these claims:
- Hidden disease: the disease is present and nobody has noticed. Atrial fibrillation (AF) is an irregular heart rhythm that comes and goes. An ECG, a recording of the heart’s electrical activity, can therefore show a normal rhythm in someone who already has AF. Attia and colleagues (2019) looked for “the electrocardiographic signature of atrial fibrillation present during normal sinus rhythm”. The comparator is the reading of the same exam.
- Future event: the disease will start later. The comparator is what age and other known facts already predict. This claim is hard to separate from hidden disease. Raghunath and colleagues (2021) wrote that “it is impossible to quantify how much of the new AF found within 1 year was detection of preexisting paroxysmal AF and how much was prediction of truly incident AF.” Paroxysmal AF is the kind that comes and goes, and incident AF is new. My own AF study has the same limit.
- Acute alert: a warning ahead of an event during a hospital stay. For an updated sepsis model, Wong and colleagues (2026) reported a lead of 1.9 to 10.3 hours before patients met the sepsis definition and 1.4 to 7.1 hours ahead of clinician recognition. The second range is the one that compares the model with the clinician.
- Screening gain: a diagnosis moves to an earlier date. The comparator is the same patients without screening, and an earlier date may or may not change how long anyone lives.
Clinician-defined onset
One standard definition of sepsis onset rests on clinician behaviour. In Seymour and colleagues (2016), antibiotics and body fluid cultures, lab tests that look for microbes, define suspected infection, and “The “onset” of infection was defined as the time at which the first of these 2 events occurred”. On this definition, “before onset” means before a clinician acted.
A model can read that behaviour in the same record. Agniel and colleagues (2018) found that the presence of a test order, whatever its result, was associated with the odds of survival in 233 of 272 tests. A model given test orders can therefore learn what a clinician already suspects, and orders may also reflect how ill a patient is.
Scoring rules can also credit late predictions. The PhysioNet 2019 challenge asked for a prediction 6 to 12 hours before onset, and its score still rewarded predictions up to 3 hours after onset. In Wong and colleagues (2021), the Epic model’s AUROC per hospital stay was 0.63 with predictions after onset excluded and 0.80 with predictions up to 3 hours after onset, so those three hours added 0.17.
Effects of design and age
The papers below report one model under two designs. In each row the model stays fixed, and the design changes which predictions or patients are counted:
| Setting | Design change | Before | After | Change |
|---|---|---|---|---|
| Sepsis, one centre | Exclude predictions after recognition | 0.62 | 0.47 | -0.15 |
| Sepsis, one centre | Exclude predictions after onset | 0.80 | 0.63 | -0.17 |
| Pancreatic cancer, 36 months | Exclude last 3 months of records | 0.879 | 0.843 | -0.036 |
| Same, above age 50 | Exclude last 3 months of records | 0.753 | 0.674 | -0.079 |
| Same, no exclusion | All ages to above age 50 | 0.879 | 0.753 | -0.126 |
| Mammography, 7 sites | Exclude cancers within 6 months | 0.75-0.84 | 0.69-0.78 | -0.03 to -0.10 by site |
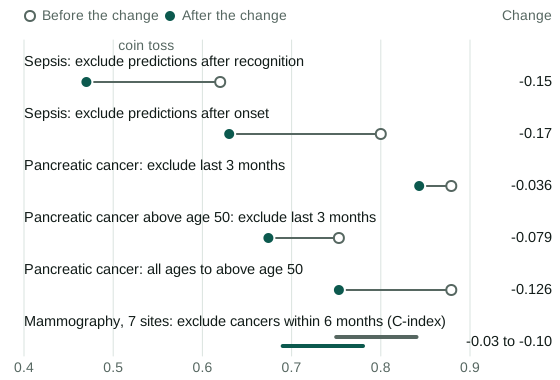
The pancreatic rows, from Placido and colleagues (2023), show that restricting age cost more than the exclusion did. Above age 50, the score fell further with longer exclusions, to 0.646 at 6 months and 0.638 at 12.
The mammography row is the Mirai model, scored by the C-index, the form of AUROC used when follow-up time varies.
In Raghunath’s AF model, age and sex alone scored an AUROC of 0.78, against 0.83 for the ECG alone and 0.85 for the two together. The ECG therefore added 0.07 to age and sex. The unadjusted hazard ratio of 7.2, the raised rate of AF in the high-risk group against the low-risk group, fell to 3.8 for women and 2.9 for men after adjustment for age and sex.
A review of mammography studies points to hidden disease at the exam. Lowry and colleagues (2026) found that 23 of 41 studies excluded cancers at or near the first mammogram, and those 23 had a lower median AUROC, about 0.68 against 0.75. The studies used different models and populations, which rules out reading the gap as the effect of the exclusion. The authors inferred that the models are “likely driven in part” by signs of hidden cancer.
Scores also fall as the horizon, the time a model looks ahead, lengthens, until near-term cancers are excluded. In the Mirai paper, at Massachusetts General Hospital, the model scored 0.84 at 1 year and 0.76 at 5 years on all exams, and 0.71 at both with cancers within 6 months excluded. Arasu and colleagues (2023) started from exams read as negative, in other patients, and found 0.68 at up to 1 year and 0.67 at 1 to 5 years.
The extra score at short horizons may come from hidden cancers at the exam, or from fast-growing cancers that start soon after it. These numbers cannot separate the two. Arasu and colleagues said that earlier, higher scores “evaluated combined diagnostic and future risk performance”.
Arasu’s design still left Mirai ahead of a clinical risk score, at 0.67 against 0.61 over 1 to 5 years, although missed cancers on negative exams could contribute to that 0.67.
Exam selection
The choice of exam changes the score. Attia’s AUROC was 0.87 with one ECG and 0.90 with all ECGs from the first month of the study window. Jabbour and colleagues (2024) reported 0.75 per ECG and 0.78 per patient. Several ECGs from one patient can add real information. Raghunath’s simulated deployment represented each patient by their highest-scoring ECG, which uses the score to choose the exam it is judged on.
Time zero
A look-back design lets the outcome choose the exam. It finds the diagnosis and takes the exam from 3 to 12 months before it, whereas a forward design fixes the exam and follows the patient. Hernán and colleagues (2016) define time zero as the point when eligibility is met and a treatment strategy is assigned. They wrote about treatment studies, and by analogy, a look-back design picks its time zero with knowledge of the outcome.
Liver cancer in cirrhosis, advanced scarring of the liver, has one paper of each kind. Guo and colleagues (2024) included patients by a CT scan 3 to 12 months before diagnosis or last follow-up, with an AUROC of 0.918 at outside centres for a model of imaging and clinical variables. Fan and colleagues (2025) started from a CT at enrolment, ruled out hidden tumours, excluded tumours arising within 3 months, and reported 0.809 to 0.869 for a clinical risk score plus CT.
The models and exclusions differ between these two papers, and I found no paper that runs one model under both designs.
My own AF study
My AF study, under review, used a forward design on hospital ECGs in MIMIC-IV, a public hospital database. The first exam was each patient’s earliest ECG in normal rhythm with no AF recorded. Patients with AF in the next 30 days were excluded, so that an episode already under way was not scored as a prediction. A control, a patient counted as staying free of AF, had to have no AF ever and to be followed for at least the horizon.
At one year, a model of the ECG plus clinical variables scored an AUROC of 0.778 (95 percent confidence interval 0.767 to 0.789) against 0.760 for clinical variables alone. The gain on the same patients was 0.019 (0.014 to 0.024). The 0.778 is below Raghunath’s 0.85, which comes from a different design and different patients.
This design has limits:
- The 30-day exclusion does not separate hidden AF from new AF. Separating them would need rhythm monitoring at the first exam.
- The outcome is a diagnosis code, so its date marks when a hospital recorded the disease.
- The control rule depends on follow-up after the exam, which leaves out patients who left care early.
- Everyone in the study came through a hospital, so the result may not hold for people outside hospital care.
- CODE-15 and PTB-XL, the outside datasets, validate identification of AF and have no dated new cases, so the prediction result rests on MIMIC-IV alone.
Diagnosis and survival
A screening gain is hard to show, because an earlier diagnosis can lengthen measured survival with no change in the date of death. Three effects can separate the date of diagnosis from survival:
- Lead-time bias: the National Cancer Institute describes longer estimated survival because “the survival calculation includes the time preceding what would have been the clinical diagnosis of the cancer in the absence of screening”.
- Length-time bias: screening finds an excess of slower-growing tumours, which have better survival anyway, as Cucchetti and colleagues (2016) describe for liver cancer.
- Overdiagnosis: in Welch and Black (2010), this is “the diagnosis of a “cancer” that would otherwise not go on to cause symptoms or death”. These patients count as survivors with no death avoided.
For liver cancer screening, Cucchetti and colleagues (2014) found a median lead time of 6.5 months. They concluded that lead-time bias is “the main determinant of the short-term benefit provided by surveillance for HCC, but this benefit becomes factual in a long-term perspective”. HCC is hepatocellular carcinoma, the main form of liver cancer.
I found no randomised trial of the models above reporting mortality or cancer stage at diagnosis.
Questions for an early detection paper
A claim of earliness can be checked with nine questions:
- Which claim is it: hidden disease, a future event, an acute alert or a screening gain?
- Earlier than what: an order, a recognition time, a radiologist’s reading, or a diagnosis code?
- Is there a score with predictions excluded after clinicians knew?
- Are outcomes close to the exam excluded, over what period, and does the exclusion also apply to the evaluation data?
- Who chose the exam, and did the outcome or the score play a part?
- Do the patients enter forward from a fixed time, or by looking back from the outcome?
- What do age and sex alone score, and what does a clinical risk score achieve in the same patients?
- Does follow-up cover the horizon?
- Is any survival claim corrected for lead time and length time?
References
- Agniel, D., Kohane, I. S. and Weber, G. M., “Biases in electronic health record data due to processes within the healthcare system: retrospective observational study”, BMJ 361, 2018. https://doi.org/10.1136/bmj.k1479
- Arasu, V. A. et al., “Comparison of mammography AI algorithms with a clinical risk model for 5-year breast cancer risk prediction”, Radiology 307, 2023. https://doi.org/10.1148/radiol.222733
- Attia, Z. I. et al., “An artificial intelligence-enabled ECG algorithm for the identification of patients with atrial fibrillation during sinus rhythm”, Lancet 394, 2019. https://doi.org/10.1016/S0140-6736(19)31721-0
- Cucchetti, A. et al., “Estimation of lead-time bias and its impact on the outcome of surveillance for the early diagnosis of hepatocellular carcinoma”, Journal of Hepatology 61, 2014. https://doi.org/10.1016/j.jhep.2014.03.037
- Cucchetti, A., Garuti, F., Pinna, A. D. and Trevisani, F., “Length time bias in surveillance for hepatocellular carcinoma and how to avoid it”, Hepatology Research 46, 2016. https://doi.org/10.1111/hepr.12672
- Fan, R. et al., “Hepatocellular carcinoma risk stratification for cirrhosis patients”, Journal of Clinical and Translational Hepatology 13, 2025. https://doi.org/10.14218/JCTH.2025.00091
- Guo, L. et al., “Early warning of hepatocellular carcinoma in cirrhotic patients by three-phase CT-based deep learning radiomics model”, eClinicalMedicine 74, 2024. https://doi.org/10.1016/j.eclinm.2024.102718
- Hernán, M. A., Sauer, B. C., Hernández-Díaz, S., Platt, R. and Shrier, I., “Specifying a target trial prevents immortal time bias and other self-inflicted injuries in observational analyses”, Journal of Clinical Epidemiology 79, 2016. https://doi.org/10.1016/j.jclinepi.2016.04.014
- Jabbour, G. et al., “Prediction of incident atrial fibrillation using deep learning, clinical models, and polygenic scores”, European Heart Journal 45, 2024. https://doi.org/10.1093/eurheartj/ehae595
- Kamran, F. et al., “Evaluation of sepsis prediction models before onset of treatment”, NEJM AI 1, 2024. https://doi.org/10.1056/AIoa2300032
- Lowry, K. P. et al., “Current state of mammography-based artificial intelligence for future breast cancer risk prediction”, Journal of the National Cancer Institute 118, 2026. https://doi.org/10.1093/jnci/djag002
- National Cancer Institute, Cancer Screening Overview (PDQ), Health Professional Version. https://www.cancer.gov/about-cancer/screening/hp-screening-overview-pdq
- Placido, D. et al., “A deep learning algorithm to predict risk of pancreatic cancer from disease trajectories”, Nature Medicine 29, 2023. https://doi.org/10.1038/s41591-023-02332-5
- Raghunath, S. et al., “Deep neural networks can predict new-onset atrial fibrillation from the 12-lead ECG and help identify those at risk of atrial fibrillation-related stroke”, Circulation 143, 2021. https://doi.org/10.1161/CIRCULATIONAHA.120.047829
- Reyna, M. A. et al., “Early prediction of sepsis from clinical data: The PhysioNet/Computing in Cardiology Challenge 2019”, Critical Care Medicine 48, 2020. https://doi.org/10.1097/CCM.0000000000004145
- Seymour, C. W. et al., “Assessment of clinical criteria for sepsis”, JAMA 315, 2016. https://doi.org/10.1001/jama.2016.0288
- Welch, H. G. and Black, W. C., “Overdiagnosis in cancer”, Journal of the National Cancer Institute 102, 2010. https://doi.org/10.1093/jnci/djq099
- Wong, A. et al., “External validation of a widely implemented proprietary sepsis prediction model in hospitalized patients”, JAMA Internal Medicine 181, 2021. https://doi.org/10.1001/jamainternmed.2021.2626
- Wong, A. et al., “Multicenter prospective validation of an updated proprietary sepsis prediction model”, JAMA Network Open 9, 2026. https://doi.org/10.1001/jamanetworkopen.2026.0181
- Yala, A. et al., “Multi-institutional validation of a mammography-based breast cancer risk model”, Journal of Clinical Oncology 40, 2022. https://doi.org/10.1200/JCO.21.01337